- (Exam Topic 4)
You use an R visual to produce a map of 500,000 customers. You include the values of CustomerID, Latitude, and Longitude in the fields sent to the visual. Each customer ID is unique.
In powerbi.com, when users load the visual, they only see some of the customers. What is the cause of the issue?
Correct Answer:D
R visuals in the Power BI service have a few limitations including: Data size limitations – data used by the R visual for plotting is limited to 150,000 rows. If more than 150,000 rows are selected, only the top 150,000 rows are used and a message is displayed on the image. Additionally, the input data has a limit of 250 MB.
Reference:
https://docs.microsoft.com/en-us/power-bi/visuals/service-r-visuals
- (Exam Topic 4)
You have a Power BI dashboard that monitors the quality of manufacturing processes. The dashboard contains the following elements: A line chart that shows the number of defective products manufactured by day. A KPI visual that shows the current daily percentage of defective products manufactured.
You need to be notified when the daily percentage of defective products manufactured exceeds 3%. What should you create?
Correct Answer:D
- (Exam Topic 4)
You are creating a column chart visualization.
You configure groups as shown in the Groups exhibit. {Click the Groups tab.)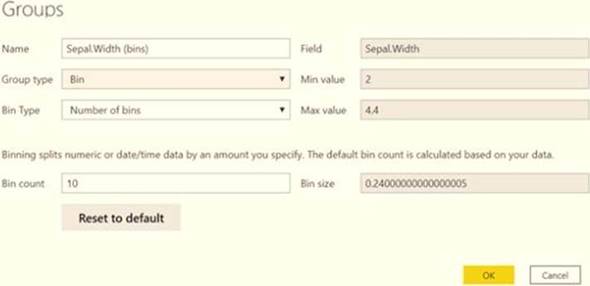
The visualization appears as shown in the Chart exhibit. (Click the Chart tab.)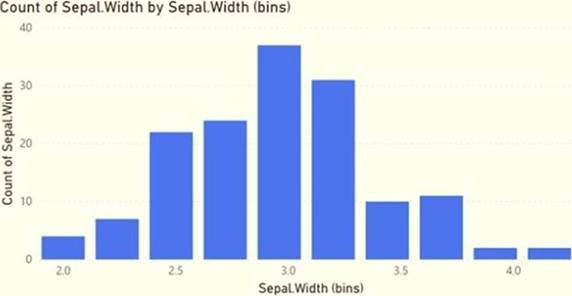
For each of the following statements, select Yes if the statement is true. Otherwise, select No. NOTE: Each correct selection is worth one point.
Solution:
Does this meet the goal?
Correct Answer:A
- (Exam Topic 4)
You have a report that contains four pages. Each page contains slicers for the same four fields. Users report that when they select values on a slicer on one page, the visuals are not updated on all the pages. You need to recommend a solution to ensure that users can select a value once to filter the results on all the pages. What are two possible recommendations to achieve this goal? Each correct answer presents a complete solution. NOTE: Each correct selection is worth one point.
Correct Answer:AE
Add a report-level filter to filter an entire report.
The visuals on the active page, and on all pages in the report, change to reflect the new filter. You can sync a slicer and use it on any or all pages in a report.
* 1. On the Power BI Desktop View menu, select Sync slicers.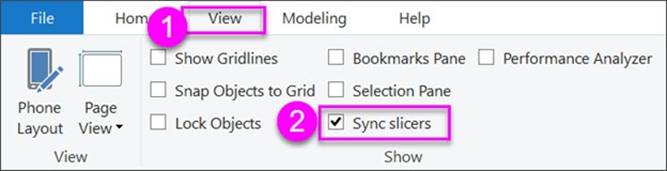
The Sync slicers pane appears between the Filters and Visualizations panes.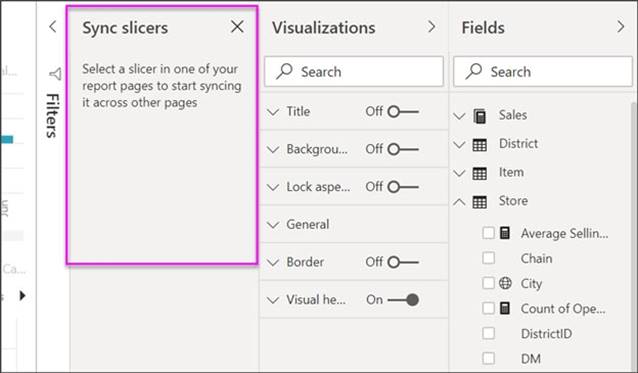
Reference:
https://docs.microsoft.com/en-us/power-bi/create-reports/power-bi-report-add-filter https://docs.microsoft.com/en-us/power-bi/visuals/power-bi-visualization-slicers