- (Exam Topic 4)
You have a large dataset that contains more than 1 million rows. The table has a datetime column named Date.
You need to reduce the size of the data model. What should you do?
Correct Answer:D
We have to separate date & time tables. Also, we don’t need to put the time into the date table, because the time is repeated every day.
Split your DateTime column into a separate date & time columns in fact table, so that you can join the date to the date table & the time to the time table. The time need to be converted to the nearest round minute or second so that every time in your data corresponds to a row in your time table.
Reference:
https://intellipaat.com/community/6461/how-to-include-time-in-date-hierarchy-in-power-bi
- (Exam Topic 4)
You need to create a measure that will return the percentage of late orders.
How should you complete the DAX expression? To answer, select the appropriate options in the answer area. NOTE: Each correct selection is worth one point.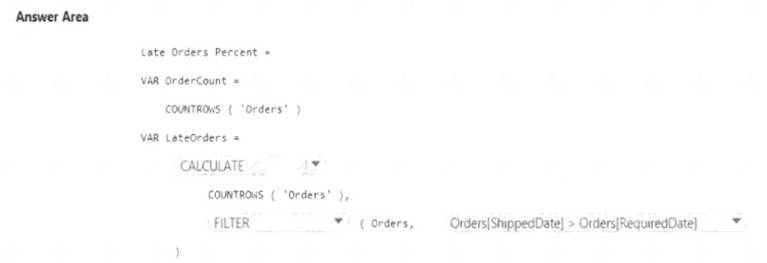
Solution:
.
Graphical user interface Description automatically generated
Does this meet the goal?
Correct Answer:A
- (Exam Topic 4)
Note: This question is part of a series of questions that present the same scenario. Each question in the series contains a unique solution that might meet the stated goals. Some question sets might have more than one correct solution, while others might not have a correct solution.
After you answer a question in this scenario, you will NOT be able to return to it. As a result, these questions will not appear in the review screen.
You have a clustered bar chart that contains a measure named Salary as the value and a field named Employee as the axis. Salary is present in the data as numerical amount representing US dollars.
You need to create a reference line to show which employees are above the median salary. Solution: You create an average line by using the Salary measure.
Does this meet the goal?
Correct Answer:B
Instead create a percentile line by using the Salary measure and set the percentile to 50%.
Note: The 50th percentile is also known as the median or middle value where 50 percent of observations fall below.
Reference:
https://dash-intel.com/powerbi/statistical_functions_percentile.php
- (Exam Topic 4)
You import a large dataset to Power Query Editor.
You need to identify whether a column contains only unique values.
Which two Data Preview options can you use? Each correct answer presents a complete solution. NOTE: Each correct selection is worth one point
Correct Answer:AD
- (Exam Topic 4)
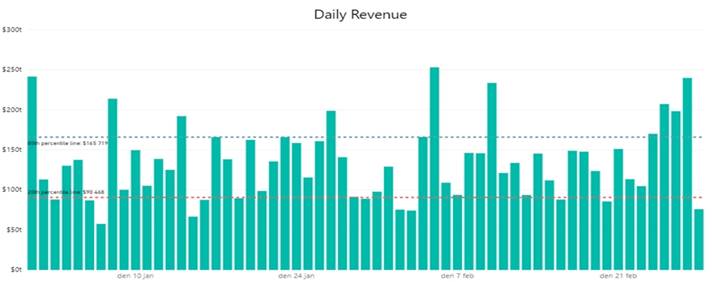
You plan to create the chart shown in the following exhibit.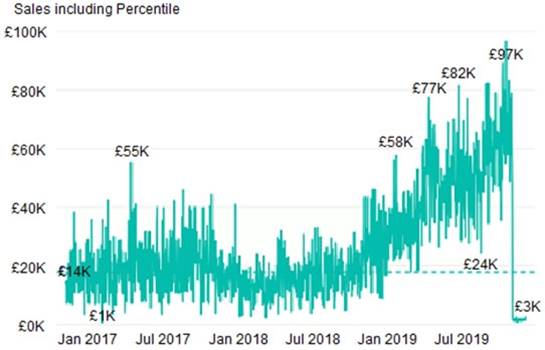
How should you create the dashed horizontal line denoting the 40th percentile of daily sales for the period shown?
Correct Answer:C
The analytics feature enables you to show percentiles across groups specified along a specific axis. Example:
* 1. Click on the analytics tab
* 2. Select Percentile
* 3. You can choose a specific percentile along with other formatting options.
* 4. Drag a date or non-numeric dimension into the Axis of a column chart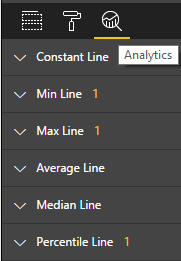
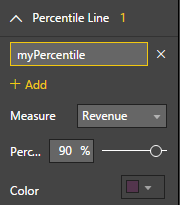
Add percentile lines to monitor daily revenue