- (Exam Topic 2)
How should you distribute the reports to the board? To answer, select the appropriate options in the answer area.
NOTE: Each correct selection is worth one point.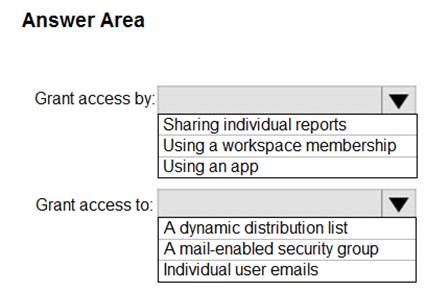
Solution:
Box 1: Using a workspace membership Scenario:
The company wants to provide a single package of reports to the board that contains custom navigation and links to supplementary information.
Note: Workspace is a shared environment for a group of people. You can have multiple Power BI content in a workspace. One workspace can have hundreds of dashboards, reports, and datasets in it.
Box 2: A mail-enabled security group Scenario: Security Requirements
The reports must be made available to the board from powerbi.com. A mail-enabled security group will be used to share information with the board.
Does this meet the goal?
Correct Answer:A
- (Exam Topic 4)
You have sales data in a star schema that contains four tables named Sales, Customer, Date, and Product. The Sales table contains purchase and ship dates.
Most often, you will use the purchase date to analyze the data, but you will analyze the data by both dates independently and together.
You need to design an imported dataset to support the analysis. The solution must minimize the model size and the number of queries against the data source.
Which data modeling design should you use?
Correct Answer:D
Only one relationship can be active.
Note: If you query two or more tables at the same time, when the data is loaded, Power BI Desktop attempts to find and create relationships for you. The relationship options Cardinality, Cross filter direction, and Make this relationship active are automatically set.
Reference:
https://docs.microsoft.com/en-us/power-bi/transform-model/desktop-create-and-manage-relationships
- (Exam Topic 4)
You are modeling data in table named SalesDetail by using Microsoft Power Bl.
You need to provide end users with access to the summary statistics about the SalesDetail data. The users require insights on the completeness of the data and the value distributions.
Which three actions should you perform in sequence? To answer, move the appropriate actions from the list of actions to the answer area and arrange them in the correct order.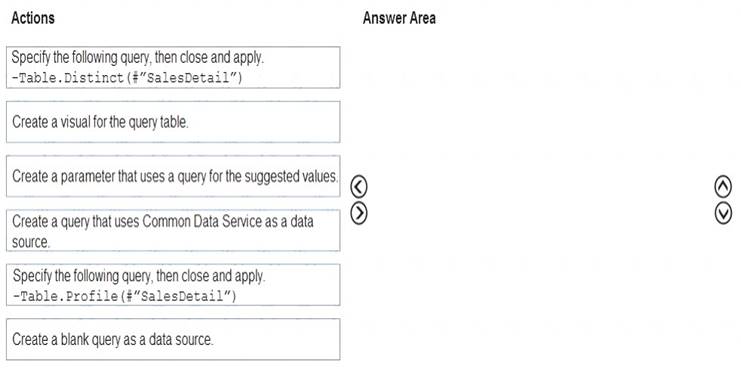
Solution: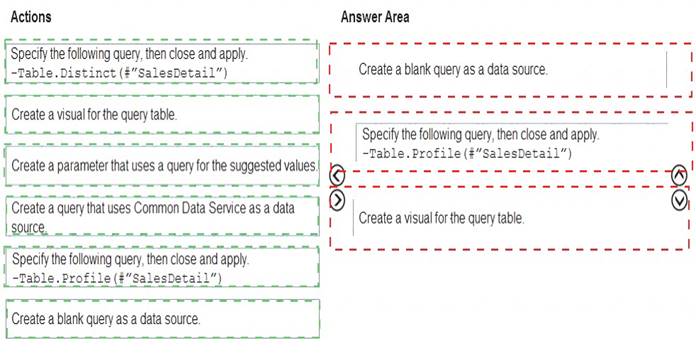
Does this meet the goal?
Correct Answer:A
- (Exam Topic 4)
Note: This question is part of a series of questions that present the same scenario. Each question in the series contains a unique solution that might meet the stated goals. Some question sets might have more than one correct solution, while others might not have a correct solution.
After you answer a question in this scenario, you will NOT be able to return to it. As a result, these questions will not appear in the review screen.
You have a clustered bar chart that contains a measure named Salary as the value and a field named Employee as the axis. Salary is present in the data as numerical amount representing US dollars.
You need to create a reference line to show which employees are above the median salary. Solution: You create a percentile line by using the Salary measure and set the percentile to 50%. Does this meet the goal?
Correct Answer:A
The 50th percentile is also known as the median or middle value where 50 percent of observations fall below. Reference:
https://dash-intel.com/powerbi/statistical_functions_percentile.php
- (Exam Topic 2)
You need to recommend a strategy to consistently define the business unit, department, and product category data and make the data usable across reports.
What should you recommend?
Correct Answer:B