- (Exam Topic 4)
You have a Power BI tenant.
You have reports that use financial datasets and are exported as PDF files. You need to ensure that the reports are encrypted.
What should you implement?
Correct Answer:C
General availability of sensitivity labels in Power BI.
Microsoft Information Protection sensitivity labels provide a simple way for your users to classify critical content in Power BI without compromising productivity or the ability to collaborate. Sensitivity labels can be applied on datasets, reports, dashboards, and dataflows. When data is exported from Power BI to Excel, PowerPoint or PDF files, Power BI automatically applies a sensitivity label on the exported file and protects it according to the label’s file encryption settings. This way your sensitive data remains protected no matter where it is.
Reference:
https://powerbi.microsoft.com/en-us/blog/announcing-power-bi-data-protection-ga-and-introducing-new-capabil
- (Exam Topic 4)
You have a table that contains sales data and approximately 1,000 rows.
You need to identify outliers in the table. Which type of visualization should you use?
Correct Answer:C
Outliers are those data points that lie outside the overall pattern of distribution & the easiest way to detect outliers is though graphs. Box plots, Scatter plots can help detect them easily.
Reference:
https://towardsdatascience.com/this-article-is-about-identifying-outliers-through-funnel-plots-using-the-microso
- (Exam Topic 4)
You have a Microsoft Power BI data model that contains three tables named Sales, Product, and Date. The Sales table has an existing measure named [Total Sales] that sums the total sales from the Sales table.
You need to write a calculation that returns the percentage of total sales that a selected ProductCategoryName value represents. The calculation must respect any slicers on ProductCategoryName and must show the percentage of visible total sales. For example, if there are four ProductCategoryName values, and a user filters one out, a table showing ProductCategoryName and the calculation must sum up to 100 percent.
How should you complete the calculation? To answer, drag the appropriate values to the correct targets. Each value may be used once, more than once, or not at all. You may need to drag the split bar between panes or scroll to view content.
NOTE: Each correct selection is worth one point.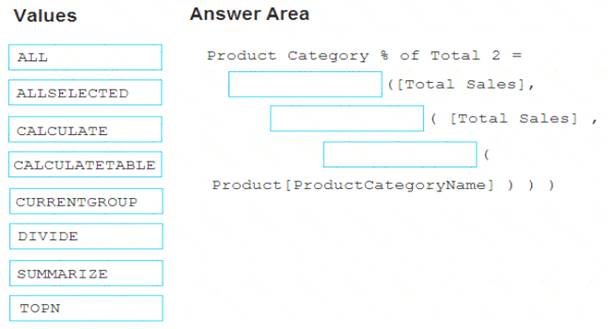
Solution:
Divide, Calculate, AllSelected. Reference:
https://docs.microsoft.com/en-us/dax/allselected-function-dax
Does this meet the goal?
Correct Answer:A
- (Exam Topic 4)
You build a report about warehouse inventory data. The dataset has more than 10 million product records from 200 warehouses worldwide. You have a table named Products that contains the columns shown in the following table.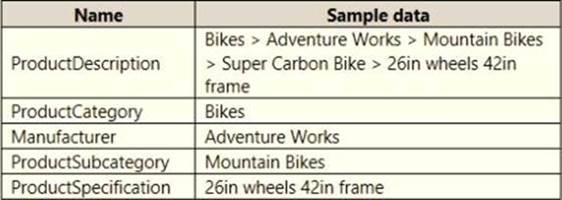
Warehouse managers report that it is difficult to use the report because the report uses only the product name in tables and visuals. The product name is contained within the ProductDescription column and is always the fourth value.
You need to modify the report to support the warehouse managers requirement to explore inventory levels at different levels of the product hierarchy. The solution must minimize the model size.
Which three actions should you perform in sequence? To answer, move the appropriate actions from the list of actions to the answer area and arrange them in the correct order.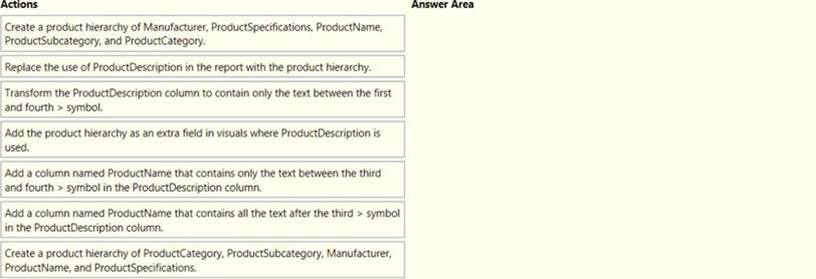
Solution: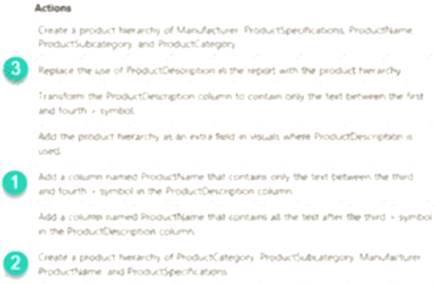
Does this meet the goal?
Correct Answer:A
- (Exam Topic 4)
Note: This question is part of a series of questions that present the same scenario. Each question in the series contains a unique solution that might meet the stated goals. Some question sets might have more than one correct solution, while others might not have a correct solution.
After you answer a question in this scenario, you will NOT be able to return to it. As a result, these questions will not appear in the review screen.
You have several reports and dashboards in a workspace.
You need to grant all organizational users read access to a dashboard and several reports.
Solution: You publish an app to the entire organization. Does this meet the goal?
Correct Answer:A
https://docs.microsoft.com/es-es/power-bi/collaborate-share/service-create-distribute-apps