The ACME Corporation hired an analyst to detect data quality issues in their Excel documents. Which of the following are the most common issues? (Select TWO)
Correct Answer:DE
* 1. Duplicates
* 2. Misspellings
The most common data quality issues are difficult to resolve in Excel because of their rigidity. It forces analysts to do a ton of manual work, which results in a high probability of an error being introduced to the data set. Those common issues include:
- Blanks
- Nulls
- Outliers
- Duplicates
- Extra spaces
- Misspellings
- Abbreviations and domain-specific variations
- Formula error codes
When introduced, these errors can skew or even invalidate the resulting analysis. A smart tool would minimize the possibility of error by automating the manual work. In Excel, you might look for data quality issues in one of two ways. First, you might use auto filters on specific columns to scan for anomalies and blanks or you might use a pivot table to find gaps and discrepancies.
In either case, you're scanning for the anomalies yourself. Suffice it to say that's not a very efficient process. It also means accuracy is only as good as the analyst's eye, so the probability of error varies throughout the day.
A data analyst is working with a team to create a dashboard for a client who requires on- demand access. Which of the following is the best delivery method to support the clients?? requirement?
Correct Answer:C
The best delivery method to support the client??s requirement is C. Subscription.
Short Explanation: A subscription is a delivery method that allows the client to access the dashboard on-demand, whenever they need it. A subscription can be set up by the data analyst or the client themselves, and it can be configured to send an email notification when the dashboard is updated or refreshed. A subscription also allows the client to view the dashboard online or download it as a file format of their choice12
* A. Email is not the best delivery method because it does not allow the client to access the dashboard on-demand. Email deliveries are sent at a fixed time or frequency, and they may not reflect the latest data or changes in the dashboard. Email deliveries also have limitations on the file size and format of the dashboard attachments1
* B. Scheduled is not the best delivery method because it does not allow the client to access the dashboard on-demand. Scheduled deliveries are similar to email deliveries, except that they are triggered by a specific event or condition, such as a data update or a threshold value. Scheduled deliveries also have the same limitations as email deliveries on the file size and format of the dashboard attachments1
* D. Static is not the best delivery method because it does not allow the client to access the dashboard on-demand. Static deliveries are one-time deliveries that are manually generated by the data analyst or the client. Static deliveries do not update or refresh automatically, and they may become outdated or irrelevant over time. Static deliveries also have limitations on the file size and format of the dashboard files3
What R package makes it easy to work with dates?
Correct Answer:A
Lubridate is an R package that makes it easier to work with dates and times.
A company??s marketing department wants to do a promotional campaign next month. A data analyst on the team has been asked to perform customer segmentation, looking at how recently a customer bought the product, at what frequency, and at what value. Which of the following types of analysis would this practice be considered?
Correct Answer:D
Customer segmentation is a type of cluster analysis, which is a method of grouping data points based on their similarities or differences. Cluster analysis can help identify patterns and trends in the data, as well as target specific groups of customers for marketing purposes. One common technique for customer segmentation is RFM analysis, which stands for recency, frequency, and monetary value. This technique assigns a score to each customer based on how recently they bought the product, how often they buy the product, and how much they spend on the product. These scores can then be used to create clusters of customers with different characteristics and preferences. Therefore, the correct answer is D. References: Cluster Analysis - Statistics Solutions, RFM Analysis: The Ultimate Guide for Customer Segmentation
Given the data below: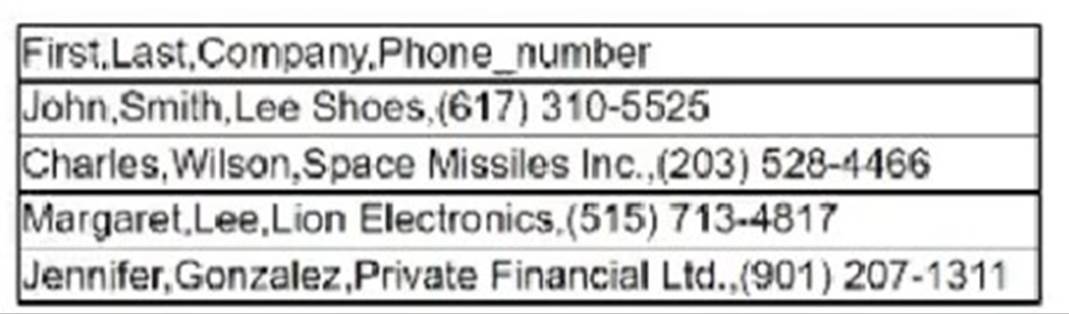
In which of the following file formats is the data presented?
Correct Answer:B
The data is presented in a CSV (comma-separated values) file format, which is a plain text format that stores tabular data. Each line of the file is a data record, and each record consists of one or more fields separated by commas. The first line of the file usually
contains the names of the fields, also known as the header. In this case, the data has four fields: Name, Age, Gender, and Occupation. Therefore, the correct answer is B. References: CSV File (What It Is & How to Open One), Comma-separated values - Wikipedia