Which of the following best describes the law of large numbers?
Correct Answer:B
The best answer is B. As a sample size grows, its mean gets closer to the average of the whole population.
The law of large numbers, in probability and statistics, states that as a sample size grows, its mean gets closer to the average of the whole population. This is due to the sample being more representative of the population as it increases in size. The law of large numbers guarantees stable long-term results for the averages of some random events1
* A. As a sample size decreases, its standard deviation gets closer to the average of the whole population is not correct, because it confuses the concepts of standard deviation and mean. Standard deviation is a measure of how much the values in a data set vary from the mean, not how close the mean is to the population average. Also, as a sample size decreases, its standard deviation tends to increase, not decrease, because the sample becomes less representative of the population.
* C. As a sample size decreases, its mean gets closer to the average of the whole population is not correct, because it contradicts the law of large numbers. As a sample size decreases, its mean tends to deviate from the average of the whole population, because the sample becomes less representative of the population.
* D. When a sample size doubles, the sample is indicative of the whole population is not correct, because it does not specify how close the sample mean is to the population average. Doubling the sample size does not necessarily make the sample indicative of the whole population, unless the sample size is large enough to begin with. The law of large numbers does not state a specific number or proportion of samples that are indicative of the whole population, but rather describes how the sample mean approaches the population average as the sample size increases indefinitely.
You are working with a dataset and need to swap the values in rows with those in columns. What action do you need to perform?
Correct Answer:D
Transpose creates a new data file in which the rows and columns in the original data file are transposed so that cases (rows) become variables and variables (columns) become
cases. Transpose automatically creates new variable names and displays a list of the new variable names.
Transposing data is useful for data analysis. At times, we have to pull data from various files with different formats for analysis and preparing reports. In such circumstances, we may have to transpose some data from one file to the other. In excel, we can transpose data in multiple ways.
Which of the following best describes the process of examining data for statistics and information about the data?
Correct Answer:C
Data profiling is the process of examining data for statistics and information about the data, such as the structure, format, quality, and content of the data. Data profiling can help to understand the characteristics, patterns, relationships, and anomalies of the data, as well as to identify and resolve any errors, inconsistencies, or missing values in the data. Data profiling can be done using various tools and methods, such as spreadsheets, databases, or programming languages12.
A customer list from a financial services company is shown below: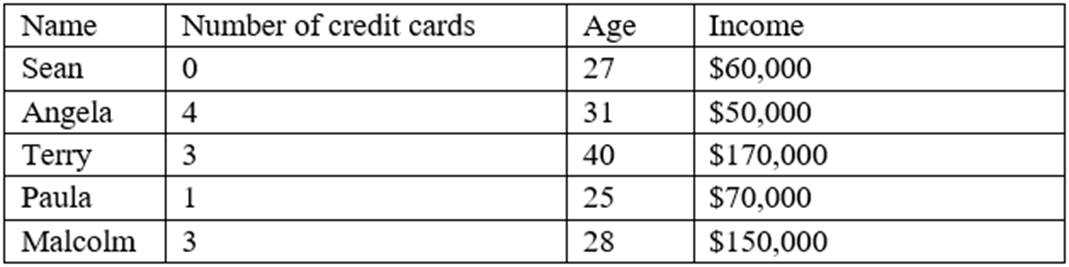
A data analyst wants to create a likely-to-buy score on a scale from 0 to 100, based on an average of the three numerical variables: number of credit cards, age, and income. Which of the following should the analyst do to the variables to ensure they all have the same weight in the score calculation?
Correct Answer:D
Normalizing the variables means scaling them to a common range, such as 0 to 1 or -1 to 1, so that they have the same weight in the score calculation. Recoding the variables means changing their values or categories, which would alter their meaning and distribution. Calculating the percentiles of the variables means ranking them relative to each other, which would not account for their actual magnitudes. Calculating the standard deviations of the variables means measuring their variability, which would not make them comparable. References: CompTIA Data+ Certification Exam Objectives, page 10
Which of the following tools would be best to use to calculate the interquartile range, median, mean, and standard deviation of a column in a table that has 5.000.000 rows?
Correct Answer:B