Amanda needs to create a dashboard that will draw information from many other data sources and present it to business leaders.
Which one of the following tools is least likely to meet her needs?
Correct Answer:D
SPSS Modeler.
QuickSight, Tableau, and Power BI are all powerful analytics and reporting tools that can pull data from a variety of sources. SPSS Modeler is a powerful predictive analytics platform that is designed to bring predictive intelligence to decisions made by individuals, groups, systems and your enterprise.
Which of the following value is the measure of dispersion "range" between the scores of ten students in a test.
The scores of ten students in a test are 17, 23, 30, 36, 45, 51, 58, 66, 72, 77.
Correct Answer:B
The correct answer is: 60
Range is the interval between the highest and the lowest score.
Range is a measure of variability or scatteredness of the varieties or observations among themselves and does not give an idea about the spread of the observations around some
central value. Symbolically R = Hs - Ls.
Where R = Range; Hs is the 'Highest score' and Ls is the Lowest Score.
The scores of ten students in a test are: 17, 23, 30, 36, 45, 51, 58, 66, 72, 77. The highest score is 77 and the lowest score is 17.
So the range is the difference between these two scores Range = 77 - 17 = 60
A data analyst for a media company needs to determine the most popular movie genre. Given the table below: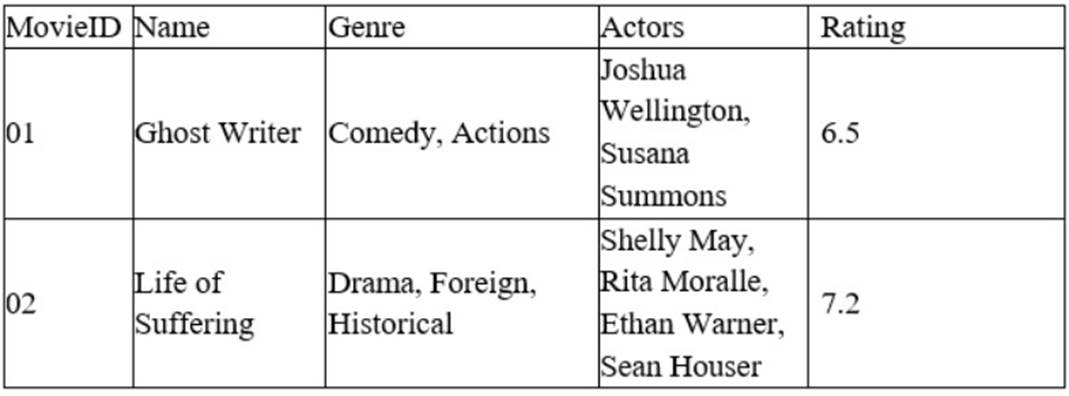
Which of the following must be done to the Genre column before this task can be completed?
Correct Answer:D
Delimiting is the process of splitting a column of data into multiple columns based on a separator or delimiter character. Delimiting can help separate data that is combined or concatenated in one column into distinct values or categories. For example, if a column contains text values that are separated by commas, such as ??Comedy, Suspense??, delimiting can split this column into two columns, one for ??Comedy?? and one for ??Suspense??. Delimiting is different from other options, such as appending, merging, or concatenating, which are methods of combining or joining data from multiple columns or sources. In this case, the data analyst needs to determine the most popular movie genre based on the Genre column in the table. However, this column contains multiple genres for each movie, separated by commas. Therefore, the data analyst must delimit this column before this task can be completed. Therefore, the correct answer is D. References: Split text into different columns with functions - Office Support, How to Split Text in Excel (Using Formulas & Split Function)
Five dogs have the following heights in millimeters: 300,430, 170, 470, 600
Which of the following is the standard deviation for the five dogs?
Correct Answer:B
The correct answer is B. 154 mm.
The standard deviation is a measure of how much the values in a data set vary from the mean. To calculate the standard deviation, we need to follow these steps:
✑ Find the mean of the data set by adding up all the values and dividing by the
number of values. In this case, the mean is (300 + 430 + 170 + 470 + 600) / 5 = 394 mm.
✑ Find the difference between each value and the mean, and square it. In this case,
the differences and their squares are:
✑ Find the sum of the squared differences. In this case, the sum is 8836 + 1296 + 50176 + 5776 + 42436 = 108520.
✑ Divide the sum by the number of values. In this case, the result is 108520 / 5 = 21704. This is called the variance.
✑ Take the square root of the variance. In this case, the result is sqrt(21704) = 147.32 mm. This is called the standard deviation.
Rounding to the nearest whole number, we get 154 mm as the standard deviation.
Given the following data: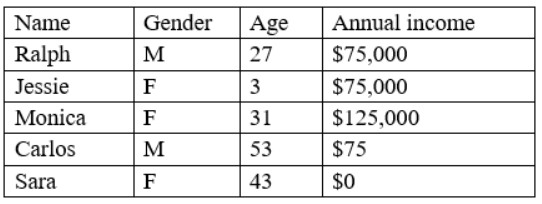
Which of the following BEST describes the data set?
Correct Answer:C
This is because inconsistency is a type of data quality issue that occurs when the data does not follow a common format, structure, or rule across different sources or systems, which can affect the efficiency and performance of the analysis or process. Inconsistency can be caused by having different spellings, punctuations, capitalizations, or abbreviations for the same or similar values in a data set, such as ??M??, ??m??, ??Male??, or ??male?? for gender in this case. Inconsistency can be eliminated or reduced by using data cleansing techniques, such as standardizing or normalizing the data values. The other options are not correct descriptions of the data set. Here is why:
✑ Data bias is a type of data quality issue that occurs when the data is not representative or proportional of the population or the parameter, which can affect the validity and reliability of the analysis or process. Data bias can be caused by having a sample that is too small, too large, or too skewed for the population or the parameter, such as having only male customers for a product that targets both genders in this case. Data bias can be eliminated or reduced by using sampling techniques, such as stratified or cluster sampling.
✑ The data is incomplete is a type of data quality issue that occurs when the data is
absent or missing in a data set, which can affect the accuracy and reliability of the analysis or process. The data is incomplete can be caused by various factors, such as human error, system error, or non-response. The data is incomplete can be addressed by using various methods, such as replacing or imputing the missing values with some reasonable estimates, such as mean, median, mode, or regression.
✑ The data is outliers is a type of data quality issue that occurs when the data has
values that are unusually high or low compared to the rest of the data set, which can affect the quality and validity of the analysis or process. The data is outliers can be caused by various factors, such as measurement error, natural variation, or extreme events. The data is outliers can be addressed by using various methods, such as removing or filtering out the outliers, or using robust statistics that are less sensitive to outliers, such as median, interquartile range, or box plot.