You have two databases tables that you would like to join together using a foreign key relationship.
What term best describes this action?
Correct Answer:D
Data merging is the process of combining two or more data sets into a single data set. Most often, this process is necessary when you have raw data stored in multiple files, worksheets, or data tables, that you want to analyze all in one go.
An analyst has been tracking company intranet usage and has been asked to create a chat to show the most-used/most-clicked portions of a homepage that contains more than 30 links. Which of the following visualizations would BEST illustrate this information?
Correct Answer:B
This is because a heat map is a visualization that uses colors to represent different values or intensities of a variable. A heat map can be used to show the most- used/most-clicked portions of a homepage that contains more than 30 links by assigning different colors to each link based on how frequently they are clicked by the users. For example, a link that is clicked very often can be colored red, while a link that is clicked rarely can be colored blue. A heat map can help the analyst to identify which links are more popular or important than others on the homepage. The other visualizations are not as effective as a heat map for this purpose. Here is why:
A scatter plot is a visualization that uses dots or points to represent the relationship between two variables. A scatter plot cannot show the most-used/most-clicked portions of a homepage that contain more than 30 links because it does not have a clear way of mapping each link to a point on the graph.
A pie chart is a visualization that uses slices or sectors to represent the proportion of each category in a whole. A pie chart cannot show the most-used/most-clicked portions of a homepage that contains more than 30 links because it does not have enough space to display all the categories clearly and accurately.
An infographic is a visualization that uses images, icons, charts, and text to convey information or tell a story. An infographic cannot show the most-used/most-clicked portions of a homepage that contain more than 30 links because it does not have a consistent or standardized way of representing each link and its click frequency.
A report is scheduled to run and be distributed at the end of business each day. On Mondays, one of the recipients opens the previous week's reports and combines them to calculate the weekly totals and projections for the coming week. This is a tedious process, and the recipient asks an analyst for help. Which of the following should the analyst recommend?
Correct Answer:B
Creating a new report that automatically calculates weekly totals would streamline the process for the recipient. By setting this report to run at the end of business on Friday, it would provide the recipient with the necessary information for the entire week in one consolidated document. This eliminates the need for manual calculations and combines the previous week??s data into one report, making it more efficient and less time- consuming.
References:
✑ Best practices in business analytics suggest automating repetitive tasks and consolidating reports where possible to improve efficiency and reduce the potential for human error.
A user imports a data file into the accounts payable system each day. On a regular basis. the field input is not what the system is expecting. so it results in an error for the row and a broken import process. To resolve the issue, the user opens the file, finds the error in the row, and manually corrects it before attempting the import again. The import sometimes breaks on subsequent attempts. though. Which of the following changes should be made to this process to reduce the number of errors?
Correct Answer:C
A data field to data type validator is a tool or a process that checks if the data in each field of a file matches the expected data type, such as text, number, date, etc. A data field to data type validator can help to identify and correct any errors or inconsistencies in the data before importing it into the accounts payable system. This would reduce the number of errors and broken imports, as well as save time and effort for the user.
A data analyst is helping a retail store categorize its customers into five different groups based on the following information:
• How recently the customers made purchases
• How frequently the customers made purchases
• How much the customers spent Given the following information: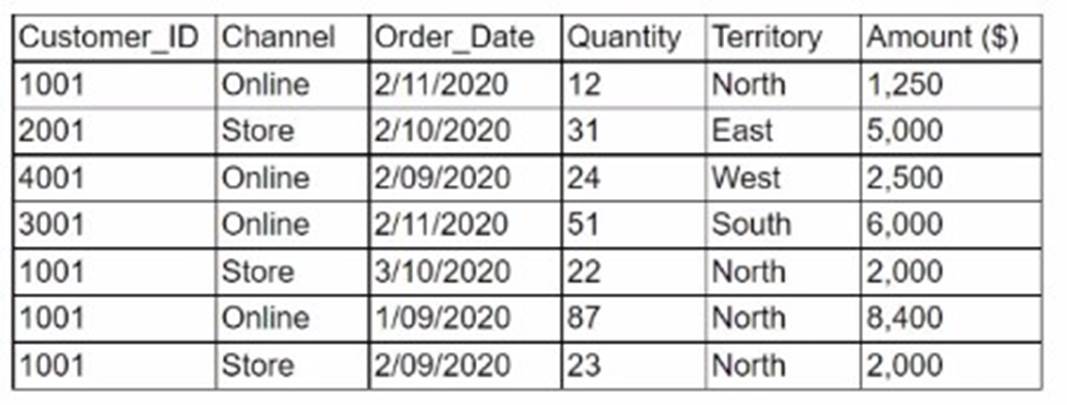
Which of the following would be most important for the analysis?
Correct Answer:C