No Installation Required, Instantly Prepare for the DP-600 exam and please click the below link to start the DP-600 Exam Simulator with a real DP-600 practice exam questions.
Use directly our on-line DP-600 exam dumps materials and try our Testing Engine to pass the DP-600 which is always updated.
- (Topic 2)
You have a Fabric tenant that contains a Microsoft Power Bl report. You are exploring a new semantic model.
You need to display the following column statistics:
• Count
• Average
• Null count
• Distinct count
• Standard deviation
Which Power Query function should you run?
Correct Answer:B
The Table.Profile function in Power Query is used to generate column statistics such as count, average, null count, distinct count, and standard deviation. You can use this function as follows:
✑ Invoke the Power Query Editor.
✑ Apply the Table.Profile function to your table.
✑ The result will be a table where each row represents a column from the original table, and each column in the result represents a different statistic such as those listed in the requirement.
References: The use of Table.Profile is part of Power Query M function documentation where it explains how to gather column statistics for a given table.
- (Topic 2)
You have a Fabric tenant that contains a semantic model named Model1. Model1 uses Import mode. Model1 contains a table named Orders. Orders has 100 million rows and the following fields.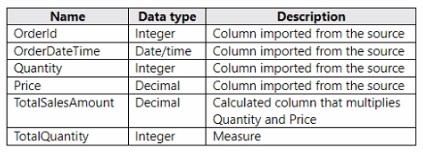
You need to reduce the memory used by Model! and the time it takes to refresh the model. Which two actions should you perform? Each correct answer presents part of the solution. NOTE: Each correct answer is worth one point.
Correct Answer:AD
To reduce memory usage and refresh time, splitting the OrderDateTime into separate date and time columns (A) can help optimize the model because date/time data types can be more memory-intensive than separate date and time columns. Moreover, replacing TotalSalesAmount with a measure (D) instead of a calculated column ensures that the calculation is performed at query time, which can reduce the size of the model as the value is not stored but calculated on the fly. References = The best practices for optimizing Power BI models are detailed in the Power BI documentation, which recommends using measures for calculations that don't need to be stored and adjusting data types to improve performance.
HOTSPOT - (Topic 1)
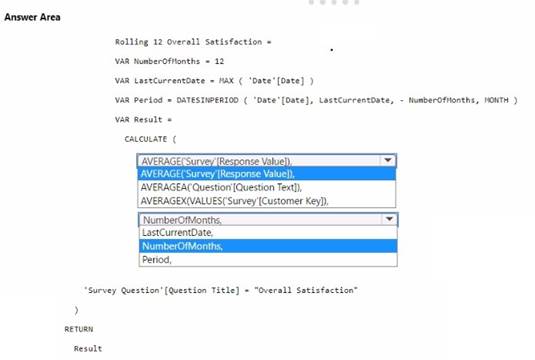
You need to create a DAX measure to calculate the average overall satisfaction score.
How should you complete the DAX code? To answer, select the appropriate options in the answer area.
NOTE: Each correct selection is worth one point.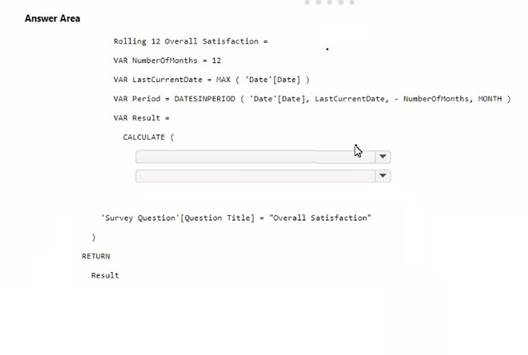
Solution:
✑ The measure should use the AVERAGE function to calculate the average value.
✑ It should reference the Response Value column from the 'Survey' table.
✑ The 'Number of months' should be used to define the period for the average calculation.
To calculate the average overall satisfaction score using DAX, you would need to use the AVERAGE function on the response values related to satisfaction questions. The DATESINPERIOD function will help in calculating the rolling average over the last 12 months.
Does this meet the goal?
Correct Answer:A
- (Topic 2)
You have a Microsoft Fabric tenant that contains a dataflow. You are exploring a new semantic model.
From Power Query, you need to view column information as shown in the following exhibit.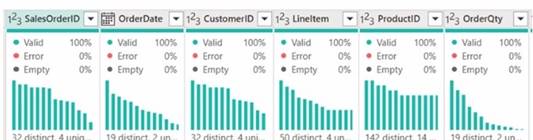
Which three Data view options should you select? Each correct answer presents part of the solution. NOTE: Each correct answer is worth one point.
Correct Answer:ABE
To view column information like the one shown in the exhibit in Power Query, you need to select the options that enable profiling and display quality and distribution details. These are: A. Enable column profile - This option turns on profiling for each column, showing statistics such as distinct and unique values. B. Show column quality details - It displays the column quality bar on top of each column showing the percentage of valid, error, and empty values. E. Show column value distribution - It enables the histogram display of value distribution for each column, which visualizes how often each value occurs.
References: These features and their descriptions are typically found in the Power Query documentation, under the section for data profiling and quality features.
- (Topic 2)
You have a Fabric warehouse that contains a table named Staging.Sales. Staging.Sales contains the following columns.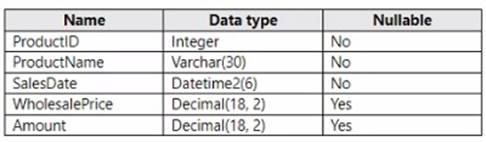
You need to write a T-SQL query that will return data for the year 2023 that displays ProductID and ProductName arxl has a summarized Amount that is higher than 10,000. Which query should you use?
A)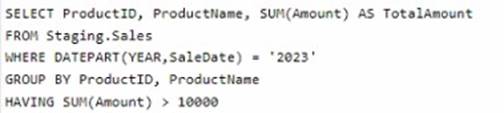
B)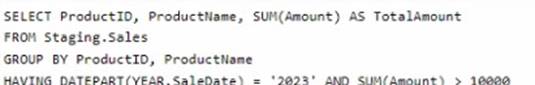
C)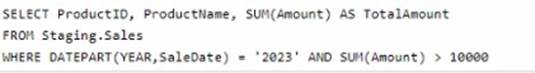
D)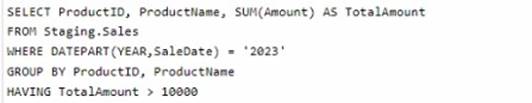
Correct Answer:B
The correct query to use in order to return data for the year 2023 that displays ProductID, ProductName, and has a summarized Amount greater than 10,000 is Option B. The reason is that it uses the GROUP BY clause to organize the data by ProductID and ProductName and then filters the result using the HAVING clause to only include groups where the sum of Amount is greater than 10,000. Additionally, the DATEPART(YEAR, SaleDate) = '2023' part of the HAVING clause ensures that only records from the year 2023 are included. References = For more information, please visit the official documentation on T-SQL queries and the GROUP BY clause at T-SQL GROUP BY.