- (Topic 2)
You have a Fabric tenant that contains a new semantic model in OneLake. You use a Fabric notebook to read the data into a Spark DataFrame.
You need to evaluate the data to calculate the min, max, mean, and standard deviation values for all the string and numeric columns.
Solution: You use the following PySpark expression: df .sumary ()
Does this meet the goal?
Correct Answer:A
Yes, the df.summary() method does meet the goal. This method is used to compute specified statistics for numeric and string columns. By default, it provides statistics such as count, mean, stddev, min, and max. References = The PySpark API documentation details the summary() function and the statistics it provides.
HOTSPOT - (Topic 2)
You have a Fabric tenant.
You plan to create a Fabric notebook that will use Spark DataFrames to generate Microsoft Power Bl visuals.
You run the following code.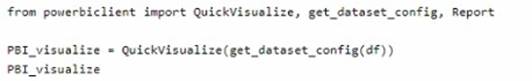
For each of the following statements, select Yes if the statement is true. Otherwise, select No. NOTE: Each correct selection is worth one point.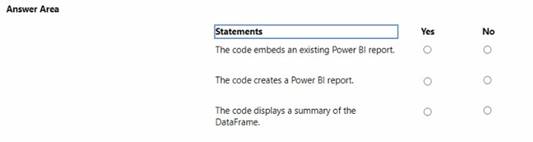
Solution:
✑ The code embeds an existing Power BI report. - No
✑ The code creates a Power BI report. - No
✑ The code displays a summary of the DataFrame. - Yes
The code provided seems to be a snippet from a SQL query or script which is neither creating nor embedding a Power BI report directly. It appears to be setting up a DataFrame for use within a larger context, potentially for visualization in Power BI, but the code itself does not perform the creation or embedding of a report. Instead, it's likely part of a data processing step that summarizes data.
References =
✑ Introduction to DataFrames - Spark SQL
✑ Power BI and Azure Databricks
Does this meet the goal?
Correct Answer:A
- (Topic 2)
You have a Fabric tenant that contains a semantic model. The model uses Direct Lake mode.
You suspect that some DAX queries load unnecessary columns into memory. You need to identify the frequently used columns that are loaded into memory.
What are two ways to achieve the goal? Each correct answer presents a complete solution. NOTE: Each correct answer is worth one point.
Correct Answer:BC
The Vertipaq Analyzer tool (B) and querying the
$system.discovered_STORAGE_TABLE_COLUMNS_IN_SEGMENTS dynamic management view (DMV) (C) can help identify which columns are frequently loaded into memory. Both methods provide insights into the storage and retrieval aspects of the semantic model. References = The Power BI documentation on Vertipaq Analyzer and DMV queries offers detailed guidance on how to use these tools for performance analysis.
- (Topic 2)
You have a Fabric tenant that contains a Microsoft Power Bl report named Report 1. Report1 includes a Python visual. Data displayed by the visual is grouped automatically and duplicate rows are NOT displayed. You need all rows to appear in the visual. What should you do?
Correct Answer:C
To ensure all rows appear in the Python visual within a Power BI report, option C, adding a unique field to each row, is the correct solution. This will prevent automatic grouping by unique values and allow for all instances of data to be represented in the visual. References = For more on Power BI Python visuals and how they handle data, please refer to the Power BI documentation.
- (Topic 2)
You have a Fabric tenant named Tenant1 that contains a workspace named WS1. WS1 uses a capacity named C1 and contains a dawset named DS1. You need to ensure read- write access to DS1 is available by using the XMLA endpoint. What should be modified first?
Correct Answer:C
To ensure read-write access to DS1 is available by using the XMLA endpoint, the C1 settings (which refer to the capacity settings) should be modified first. XMLA endpoint configuration is a capacity feature, not specific to individual datasets or workspaces. References = The configuration of XMLA endpoints in Power BI capacities is detailed in the Power BI documentation on dataset management.