- (Exam Topic 4)
You receive revenue data that must be included in Microsoft Power Bl reports.
You perform an initial load of the data from a Microsoft Excel source as shown in the following exhibit.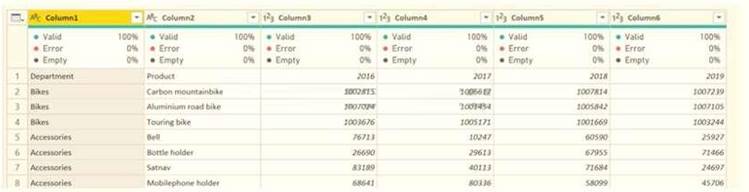
You plan to create several visuals from the data, including a visual that shows revenue split by year and product.
You need to transform the data to ensure that you can build the visuals. The solution must ensure that the columns are named appropriately for the data that they contain.
Which three actions should you perform in sequence? To answer, move the appropriate actions from the list of actions to the answer area and arrange them in the correct order.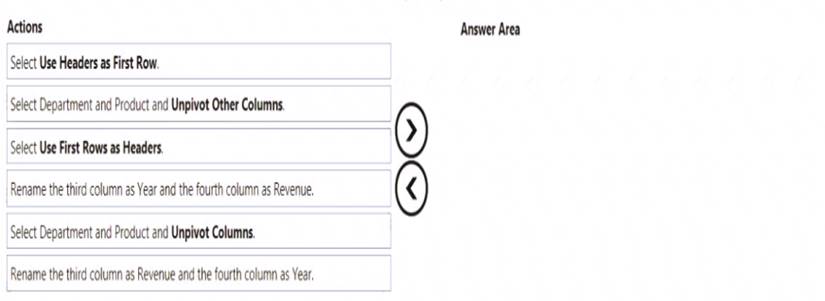
Solution:
Text Description automatically generated with medium confidence
Step 1: Select Use Header as First Row.
Step 2: Select Department and Product and Unpivot Other Columns
Unpivot Other Columns: This command unpivots unselected columns. Use this command in a query when not all columns are known. New columns added during a refresh operation are also unpivoted.
Step 3: Rename the Attribute column to Year and the Value column to Revenue.
You might want to unpivot data, sometimes called flattening the data, to put it in a matrix format so that all similar values are in one column. This is necessary, for example, to create a chart or a report.
Chart Description automatically generated with medium confidence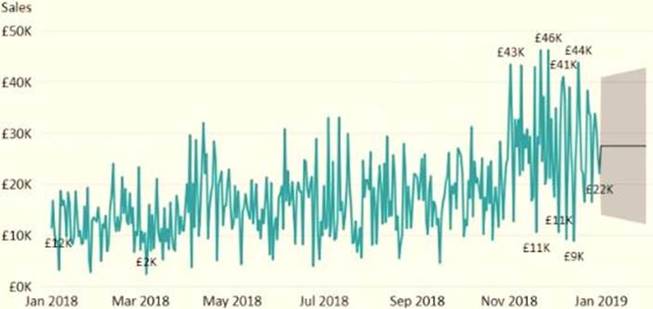
When you unpivot, you unpack the attribute-value pairs that represent an intersection point of the new columns and re-orient them into flattened columns:
Values (in blue on the left) are unpivoted into a new column (in blue on the right).
Attributes (in green on the left) are unpivoted into a new column (in green on the right) and duplicates are correspondingly mapped to the new Values column.
Reference:
https://support.microsoft.com/en-us/office/unpivot-columns-power-query-0f7bad4b-9ea1-49c1-9d95-f588221c7
Does this meet the goal?
Correct Answer:A
- (Exam Topic 4)
You need to create a visualization that compares revenue and cost over time. Which type of visualization should you use?
Correct Answer:C
A line chart or line graph displays the evolution of one or several numeric variables. Data points are connected by straight line segments. A line chart is often used to visualize a trend in data over intervals of time – a time series – thus the line is often drawn chronologically.
Example:
Reference:
https://www.data-to-viz.com/graph/line.html
- (Exam Topic 4)
You plan to create the Power Bl model shown in the exhibit. (Click the Exhibit tab.) The data has the following refresh requirements:
• Customer must be refreshed daily.
• Date must be refreshed once every three years.
• Sales must be refreshed in near real time.
• SalesAggregate must be refreshed once per week.
You need to select the storage modes for the tables. The solution must meet the following requirements: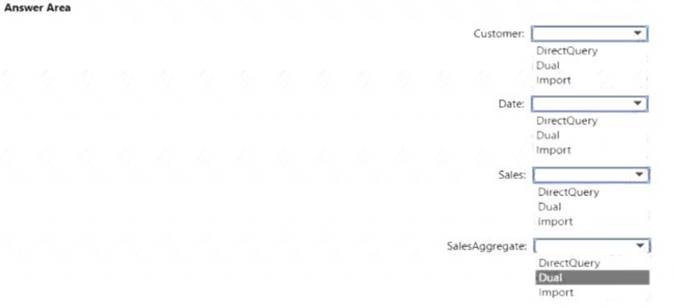
Solution: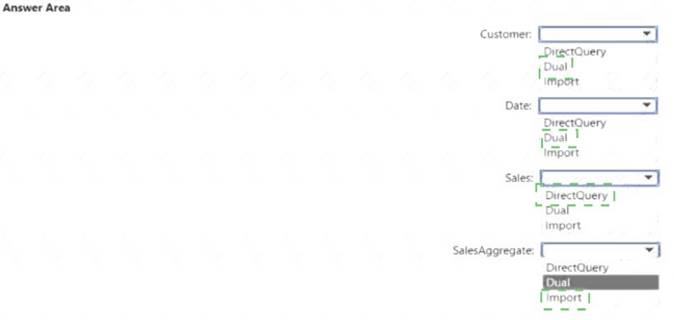
Does this meet the goal?
Correct Answer:A
- (Exam Topic 4)
In Power Bi Desktop, you are creating visualizations in a report based on an imported dataset
You need to allow Power Bi users to export the summarized data used to create the visualizations but prevent the users from exporting the underlying data
What should you do?
Correct Answer:B
- (Exam Topic 4)
You have sales data in a star schema that contains four tables named Sales, Customer, Date, and Product. The Sales table contains purchase and ship dates.
Most often, you will use the purchase date to analyze the data, but you will analyze the data by both dates independently and together.
You need to design an imported dataset to support the analysis. The solution must minimize the model size and the number of queries against the data source.
Which data modeling design should you use?
Correct Answer:D
Only one relationship can be active.
Note: If you query two or more tables at the same time, when the data is loaded, Power BI Desktop attempts to find and create relationships for you. The relationship options Cardinality, Cross filter direction, and Make this relationship active are automatically set.
Reference:
https://docs.microsoft.com/en-us/power-bi/transform-model/desktop-create-and-manage-relationships