- (Exam Topic 4)
You plan to create the chart shown in the following exhibit.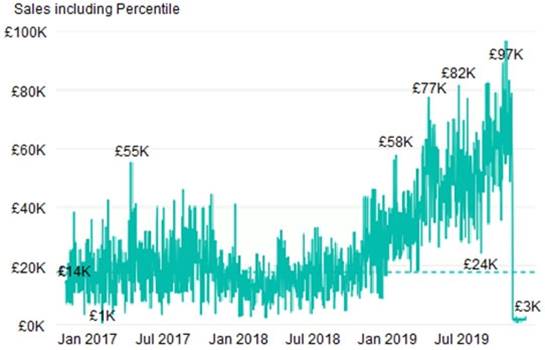
How should you create the dashed horizontal line denoting the 40th percentile of daily sales for the period shown?
Correct Answer:C
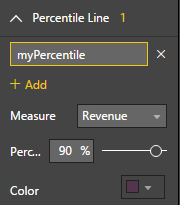
The analytics feature enables you to show percentiles across groups specified along a specific axis. Example:
* 1. Click on the analytics tab
* 2. Select Percentile
* 3. You can choose a specific percentile along with other formatting options.
* 4. Drag a date or non-numeric dimension into the Axis of a column chart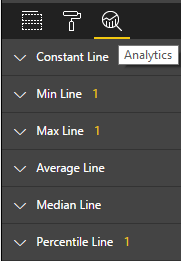
Add percentile lines to monitor daily revenue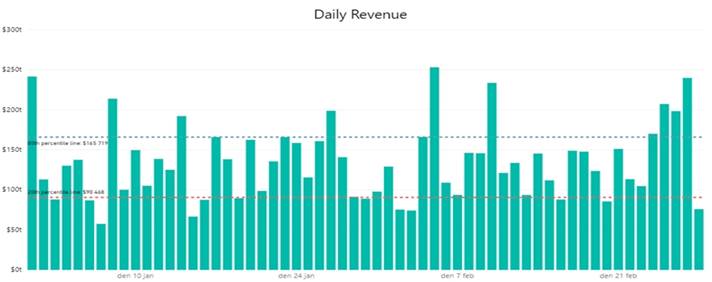
- (Exam Topic 4)
You plan to create a dashboard in the Power BI service that retrieves data from a Microsoft SQL Server database. The dashboard will be shared between the users in your organization.
You need to ensure that the users will see the current data when they view the dashboard. How should you configure the connection to the data source?
Correct Answer:D
References:
https://docs.microsoft.com/en-us/power-bi/desktop-directquery-about#power-bi-connectivity-modes
- (Exam Topic 4)
You have a collection of reports for the HR department of your company. The datasets use row-level security (RLS). The company has multiple sales regions that each has an HR manager. You need to ensure that the HR managers can interact with the data from their region only. The HR managers must be prevented from changing the layout of the reports. How should you provision access to the reports for the HR managers?
Correct Answer:C
Note: Row-level security (RLS) with Power BI can be used to restrict data access for given users. Filters restrict data access at the row level, and you can define filters within roles. In the Power BI service, members of a workspace have access to datasets in the workspace. RLS doesn't restrict this data access.
Reference:
https://docs.microsoft.com/en-us/power-bi/admin/service-admin-rls
- (Exam Topic 1)
You need to create a relationship between the Weekly_Returns table and the Date table to meet the reporting requirements of the regional managers. What should you do?
Correct Answer:A
Scenario: Region managers require a visual to analyze weekly sales and returns. To relate the two tables we need a common column.
- (Exam Topic 4)
You plan to create a Power Bl dataset to analyze attendance at a school. Data will come from two separate views named View1 and View? in an Azure SQL database. View1 contains the columns shown in the following table.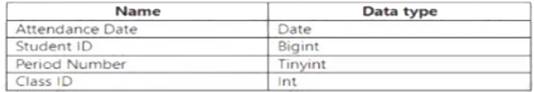
View2 contains the columns shown in the following table.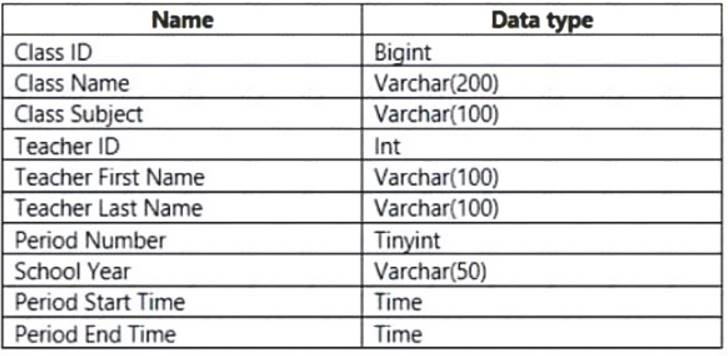
The views can be related based on the Class ID column.
Class ID is the unique identifier for the specified class, period, teacher, and school year. For example, the same class can be taught by the same teacher during two different periods, but the class will have a different class ID.
You need to design a star schema data model by using the data in both views. The solution must facilitate the following analysis: The count of classes that occur by period The count of students in attendance by period by day
 The average number of students attending a class each month
In which table should you include the Teacher First Name and Period Number fields? To answer, select the appropriate options in the answer area.
NOTE: Each correct selection is worth one point.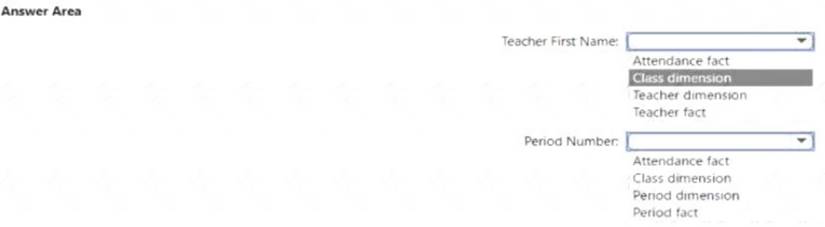
Solution:
Teacher dimension Class dimension
Does this meet the goal?
Correct Answer:A