Is it possible to deploy a URL action on a dashboard object to open a Web Page within a dashboard rather than opening the system’s web browser?
Correct Answer:C
To interactively display information from the web INSIDE a dashboard, you can use a URL action with a web page object.
For example, you might have a dashboard that shows profits by country. In addition to showing the profit data in your dashboard, you also want to display supplemental information about the countries from a web site.


Reference: https://help.tableau.com/current/pro/desktop/en-us/actions_dashboards.htm
Using the CoffeeChain table, create a Dual Axis chart showing the Sales (Bar chart) and Profit (Line Chart) for each Product type. What was the Profit for the Herbal Tea product type in 2013?
Correct Answer:C
If you answered this question quickly and correctly, you're well prepared for the exam! Most students stumble while creating a Dual axis chart, so go ahead and give yourself a pat on the back!
To create a dual axis chart for the problem mentioned:
1) Drag Product Type to the column shelf, and Sales and Profit to the Row shelf:
2) Now, to focus on 2013, drag Date to the filter shelf and select only 2013:

3) Now, click on the Profit pill in the Rows Shelf, and select dual axis:
4) Now, in the marks shelf, choose Sales, and change the chart type to bar. Similarly, for Profit, change the chart type to Line.
Now the chart looks like this:
Now we change the Profit chart type to line:

5) Finally, we synchronise the axis as follows: Right click on the axis, and choose 'Synchronise axis'
And, our final view and answer is:
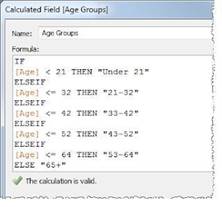
For creating variable sized bins we use ______
Correct Answer:A
One way to view a measure in Tableau Desktop is to split it into bins. You can think of bins as buckets based on a range of values. For example, say you have a measure that represents age. Instead of aggregating the measure to calculate the average age, you can bin the measure to define age groups: 0–5, 6–10, 11–15, and so on. Then you can count the number of people in each age group.
Create a calculated field for variable bin size Step 1
Select Analysis > Create Calculated Field. Step 2
In the Calculated Field dialog box, complete the following steps:
Reference: https://riti-ritesh.blogspot.com/2016/07/creating-variable-sized-bins_8.html
Which of the following are valid ways to trigger actions for a Dashboard?
Correct Answer:ACD
Explanation
Whenever we want to add actions to a Dashboard, we can trigger then in the following 3 ways:
1) Select
2) Hover
3) Menu
Hover is best for highlighting, select for filtering. Menu action is added to the tooltip and user can decide whether to run that action or not (best for URL actions)
Reference: https://help.tableau.com/current/pro/desktop/en-us/actions_dashboards.htm
Suppose I have the following view. What will be the total number of marks if I drag a new measure to the row shelf vs the column shelf?
Correct Answer:A
This is a tricky question often asked in the exam.
If we drag a new measure to the row shelf, the following happens:
We now have 2 rows, and the same 7 columns for both these rows. Therefore, 2x7 = 14 marks!
But if we drag the same measure to the column shelf, we have just 1 row and a chart created for each of the columns. So (1x7) = 7 marks!
Reference and notes: https://medium.com/@justindixon91/tableau-specialist-exam-notes- part-4-understanding-tableau-concepts-f78de83fdd35