What are two ways to share a dashboard as an image file? Choose two.
Correct Answer:AD
You can share a dashboard as an image file by using one of the following methods: Export Image on the Dashboard menu, or a dashboard export button. Export Image on the Dashboard menu allows you to export the dashboard as an image file in BMP, JPEG, PNG, or SVG format. A dashboard export button is a custom button that you can create on your dashboard to export it as an image file using a URL action
Which of the following chart type makes use of 'binned' data?
Correct Answer:C
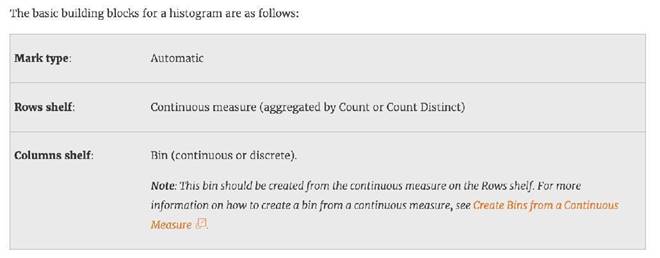
A histogram is a chart that displays the shape of a distribution. A histogram looks like a bar chart but groups values for a continuous measure into ranges, or bins.
Reference: https://help.tableau.com/current/pro/desktop/en- us/buildexamples_histogram.htm
To display data that has both negative and positive quantitative values, Tableau Desktop will display marks by using ______ as the default.
Correct Answer:B
Tableau Desktop will display marks by using a diverging palette as the default to display data that has both negative and positive quantitative values. A diverging palette is a type of color palette that uses two different color ranges to show positive and negative values. For example, a red-green diverging palette uses shades of red for negative values and shades of green for positive values. A diverging palette is automatically applied when there are both negative and positive values for a measure that is placed on Color on the Marks card5 The other options are not correct types of color palettes that Tableau Desktop uses as the default for data with both negative and positive values. A full color range is not a valid term for a color palette in Tableau. A sequential palette is a type of color palette that uses different shades of one color to show variations in a single measure. A sequential palette is usually applied when there are only positive values for a measure that is placed on Color on the Marks card5 A categorical palette is a type of color palette that uses different colors to show discrete values or categories. A categorical palette is usually applied when there is a dimension that is placed on Color on the Marks card5
Is SUM a table calculation?
Correct Answer:B
SUM is an aggregate function, not a table calculation!
A table calculation is a transformation you apply to the values in a visualization. Table calculations are a special type of calculated field that computes on the local data in Tableau. They are calculated based on what is currently in the visualization and do not consider any measures or dimensions that are filtered out of the visualization.
The most common Table calculations are: Running Total
Percent Difference Difference
Percent of Total Rank
Percentile

These can be calculated using : Table(across), Cell, or Specific dimensions! Reference: https://help.tableau.com/current/pro/desktop/en-us/calculations_tablecalculations_definebasic_runningtotal.htm
You need to access options to change a dimension's color palette. In addition to the Marks card, what else can you use?
Correct Answer:A
You can use the Color legend to access options to change a dimension’s color palette, in addition to the Marks card. The Color legend shows the colors assigned to each member of the dimension in the view. You can right-click on the Color legend and select Edit Colors to open the Edit Colors dialog box, where you can change the color palette, assign specific colors to dimension members, or edit the color transparency and border6 The other options are not valid ways to change a dimension’s color palette. Edit in Shelf is a feature that allows you to edit the fields on the Rows or Columns shelves by typing directly on the shelf. It does not affect the color palette of the dimension7 The Format menu allows you to change the appearance of various elements in the workbook, such as fonts, borders, shading, alignment, etc. It does not have options for changing the color palette of the dimension8 Edit Caption is a feature that allows you to add or edit a caption for a worksheet or dashboard. It does not affect the color palette of the dimension