Which of the following options best describe measures?
Correct Answer:D
Data fields are made from the columns in your data source. Each field is automatically assigned a data type (such as integer, string, date), and a role: Discrete Dimension or Continuous Measure (more common), or Continuous Dimension or Discrete Measure (less common).
Dimensions contain qualitative values (such as names, dates, or geographical data). You can use dimensions to categorize, segment, and reveal the details in your data. Dimensions affect the level of detail in the view.
Measures contain numeric, quantitative values that you can measure. Measures can be aggregated. When you drag a measure into the view, Tableau applies an aggregation to that measure (by default).
Reference: https://help.tableau.com/current/pro/desktop/en- us/datafields_typesandroles.htm
Broadly speaking, when users connect to Tableau, the data fields in their data set are automatically assigned a ______ and a ______.
Correct Answer:A
When users connect to Tableau, the data fields in their data set are automatically assigned a role and a type.
Role can be of the following two types:
1) Dimension
2) Measure
Type can be of the following :
1) String
2) Number
3) Geographic
4) Boolean
5) Date
6) Date and Time
Which action describes the process for changing a measure so that it automatically aggregates an average instead of a sum?
Correct Answer:A
To change a measure so that it automatically aggregates as an average instead of a sum, you should right-click the field in the Data pane and select Default Properties. In the Default Properties menu, you can set the default aggregation for the measure, such as setting it to calculate an average by default when added to a view.
What should you use to apply bold text formatting to rows or columns independent of each other?
Correct Answer:B
To apply bold text formatting to rows or columns independently in Tableau, you should use the Rows tab or the Columns tab on the Format Font pane. This approach provides control over the formatting of text within individual rows or columns. By selecting the appropriate tab (Rows or Columns), you can apply formatting settings, including bold text, to only the selected rows or columns. This is a crucial feature for enhancing the readability and visual appeal of specific parts of a Tableau worksheet, allowing for emphasis on particular data points or categories.
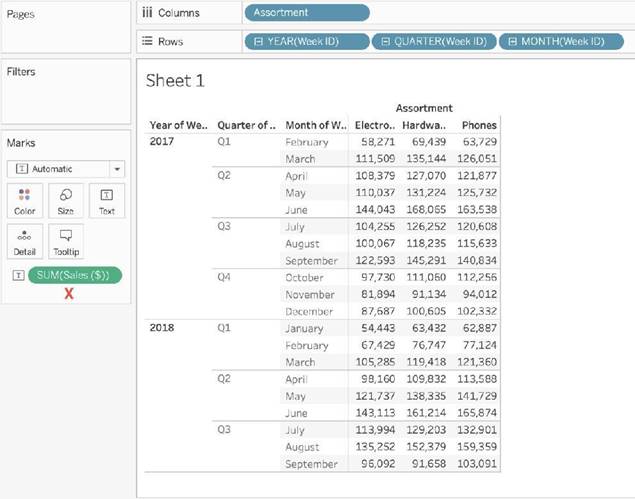
Using the Time Series table, create a cross-tab showing sales for each Assortment broken down by Year and Quarter. In Q4 of October 2017, what was the Average sales amount for the Hardware assortment?
Correct Answer:C
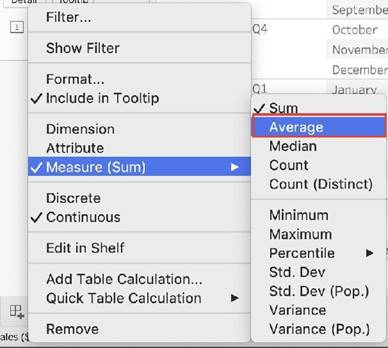
If you chose 111,060 you were SO close to the correct answer but made a small mistake - you didn't change the aggregation to AVERAGE! This is one of the common mistakes many test takers make, so keep this in mind.
To reach the correct answer, follow the steps below:
1) Draw Assortment to the Column shelf, and drag Year to the Rows Shelf. Then Drill down further on Year to accomodate Quarters and Months as well!
Although this seems enough, DON'T FORGET to change the aggregation like in the next step, which will completely change the values!

✑ The correct answer as you can see is 1,461 - Sales for Harware Assortment in 2017 Q4, October