Which two types of fields appear blue? Choose two.
Correct Answer:BD
Discrete measures and discrete dimensions appear blue in Tableau. Discrete fields are those that have a finite number of distinct values, such as names, categories, or dates. Discrete fields are usually used to create headers or labels in the view. Blue fields indicate that the field is discrete. Continuous measures and continuous dimensions appear green in Tableau. Continuous fields are those that have an infinite range of possible values, such as numbers or ratios. Continuous fields are usually used to create axes or color gradients in the view. Green fields indicate that the field is continuous1
The View Data window displays as much of the data as possible by default, up to _____ rows.
Correct Answer:C
The View Data window displays as much of the data as possible by default, up to 10,000 rows. This can be increased though, if you wish to.
Read more: https://help.tableau.com/current/pro/desktop/en-gb/inspectdata_viewdata.htm
How can you format numbers in Tableau as currency?
Correct Answer:A
According to the official Tableau documentation: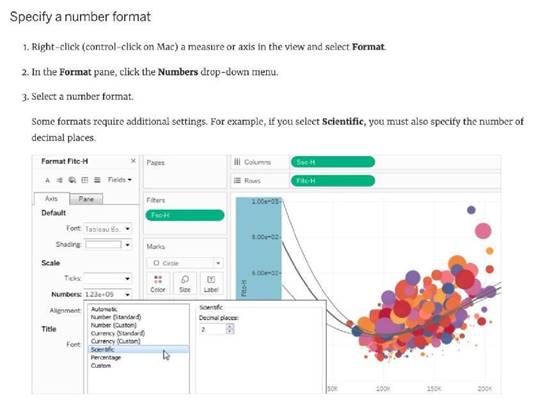
Reference: https://help.tableau.com/current/pro/desktop/en- us/formatting_specific_numbers.htm
DOWNLOAD THE DATASET FROM:
https://drive.google.com/drive/folders/1WXzqsrNmXVdmQ- 574wld4InEplyKT8RP?usp=sharing (if you haven't already)
Using the cwurData table, plot a Map to see which country had the Second highest number of patents in the Year 2013?
Correct Answer:B
Follow along to get the correct Answer
✑ Drag Country to the view, and then Patents to the Size Mark on the Marks shelf as follows :
2) But, this isn't all right? We need to focus on the year 2013. This can be done by using the year column as it is (continuous) in the filter shelf, or by converting it to discrete first and then using it:
* 2.1 As it is (continuous)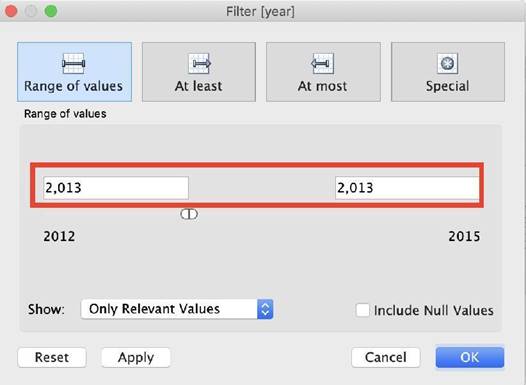
* 2.2 Converting to discrete first & then using it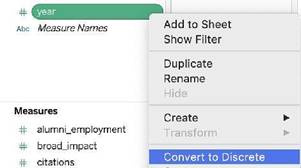
and then :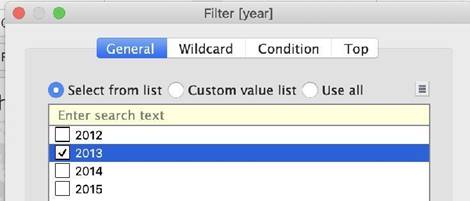
3) We can now see that France, with 485 has the 2nd most number of patents for the year 2013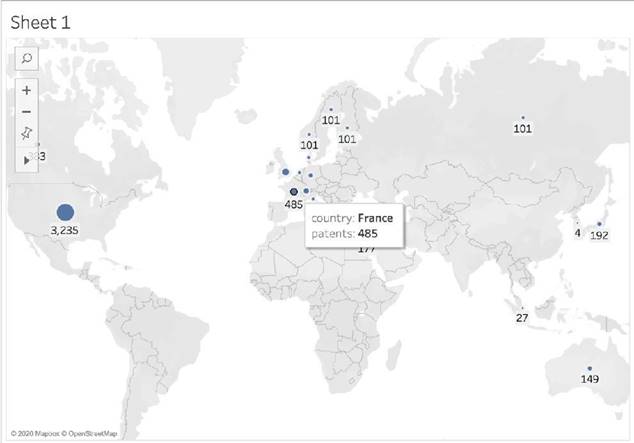
Using the Time Series Table, create a Line chart showing the Monthly Year over Year Growth for the Sales, broken down by Assortment. For the Electronics assortment, which Month had the most NEGATIVE value of Year over Year Growth?
Using the Time Series Table, create a Line chart showing the Monthly Year over Year Growth for the Sales, broken down by Assortment. For the Electronics assortment, which Month had the most NEGATIVE value of Year over Year Growth?
Correct Answer:A
Explanation Follow along:
1) Drag Assortment and Year ID (choose Discrete Month) to Columns shelf, and Sales to the Columns Shelf.
For sales, click on the pill -> choose Quick Table calculation -> Year over Year growth. The view should now look like:
It is clear that October with -55.3% had the lowest Year on Year growth.