Which statement accurately describes creating a group by selecting headers in a view?
Correct Answer:C
When creating a group by selecting headers in a Tableau view, the newly created grouped dimension replaces the original dimension field on either the Rows or Columns shelf. This grouping action aggregates the selected headers into a single group, and this new group dimension is automatically placed in the view, replacing the original dimension. This functionality allows for more simplified and customized categorization within the data visualization, enhancing the ability to analyze and interpret data according to specific groupings.
You have a continuous numeric measure named Sales.
Which chart type is created when you double-click the Sales measure?
Correct Answer:B
When you double-click a continuous numeric measure named Sales in Tableau, it automatically creates a bar chart. Tableau's default behavior for a single measure is to display it as a bar chart, with the measure values represented on the Y-axis and an automatic range on the X-axis.
Data blending simulates a traditional _______ Join
Correct Answer:D
Data blending simulates a traditional left join. The main difference between the two is when the aggregation is performed. A join combines the data and then aggregates. A blend aggregates and then combines the data.
From the official website:

Reference: https://help.tableau.com/current/pro/desktop/en-us/multiple_connections.htm
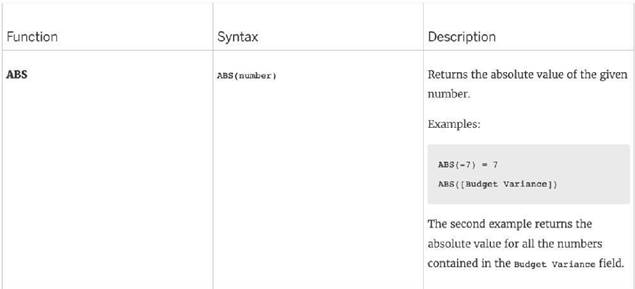
Which of the following returns the Absolute Value of a given number?
Correct Answer:A
From the official Tableau website:


Reference: https://help.tableau.com/current/pro/desktop/en- us/functions_functions_number.htm
Tableau will automatically create a hierarchy for which two kinds of data? Choose two.
Correct Answer:AD
Tableau will automatically create a hierarchy for date and geographic data. A hierarchy is a way of organizing data into different levels of detail. For example, a date hierarchy can have year, quarter, month, and day levels. A geographic hierarchy can have country, state, city, and zip code levels. Tableau recognizes date and geographic data based on their data types and formats, and creates hierarchies for them by default. Tableau does not automatically create hierarchies for date & time or string data3